Quickstart
This quickstart guide provides a brief overview of the main features of the chemdiagrams package. For a more detailed introduction and examples, please refer to the Usage section of the documentation: https://tonner-zech-group.github.io/chem-diagrams/usage/.
Drawing paths
from chemdiagrams import EnergyDiagram

dia = EnergyDiagram()

dia.draw_path(
    x_data=[0, 1, 2, 3, 4, 5],
    y_data=[0, -13, 22, 75, 39, 20],
    color="blue",
    path_name="Pathway A",
    linetypes=[2, 3, 4, -1, 0],
)
dia.draw_path(
    x_data=[0, 1, 2, 3, 5],
    y_data=[0, -25, 20, 50, 6],
    color="red",
    path_name="Pathway B",
)

dia.legend(fontsize=7)
dia.add_numbers_auto()
dia.set_xlabels(["A", "B", "C", "D", "E", "F"])
dia.ax.set_ylabel("Energy / kJ mol$^{-1}$", fontsize=8)
dia.show()
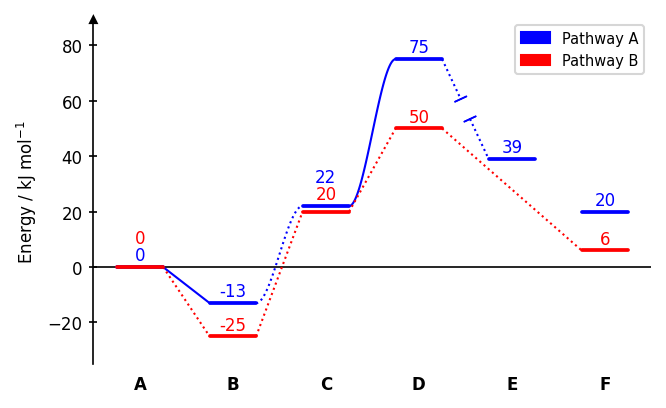
Connector styles (linetypes): 0 none, 1 dotted (default), -1 dotted with gap, 2 solid, -2 solid with gap, 3 dotted spline, -3 dotted spline with gap, 4 solid spline, -4 solid spline with gap. A single integer applies the same style to all segments.
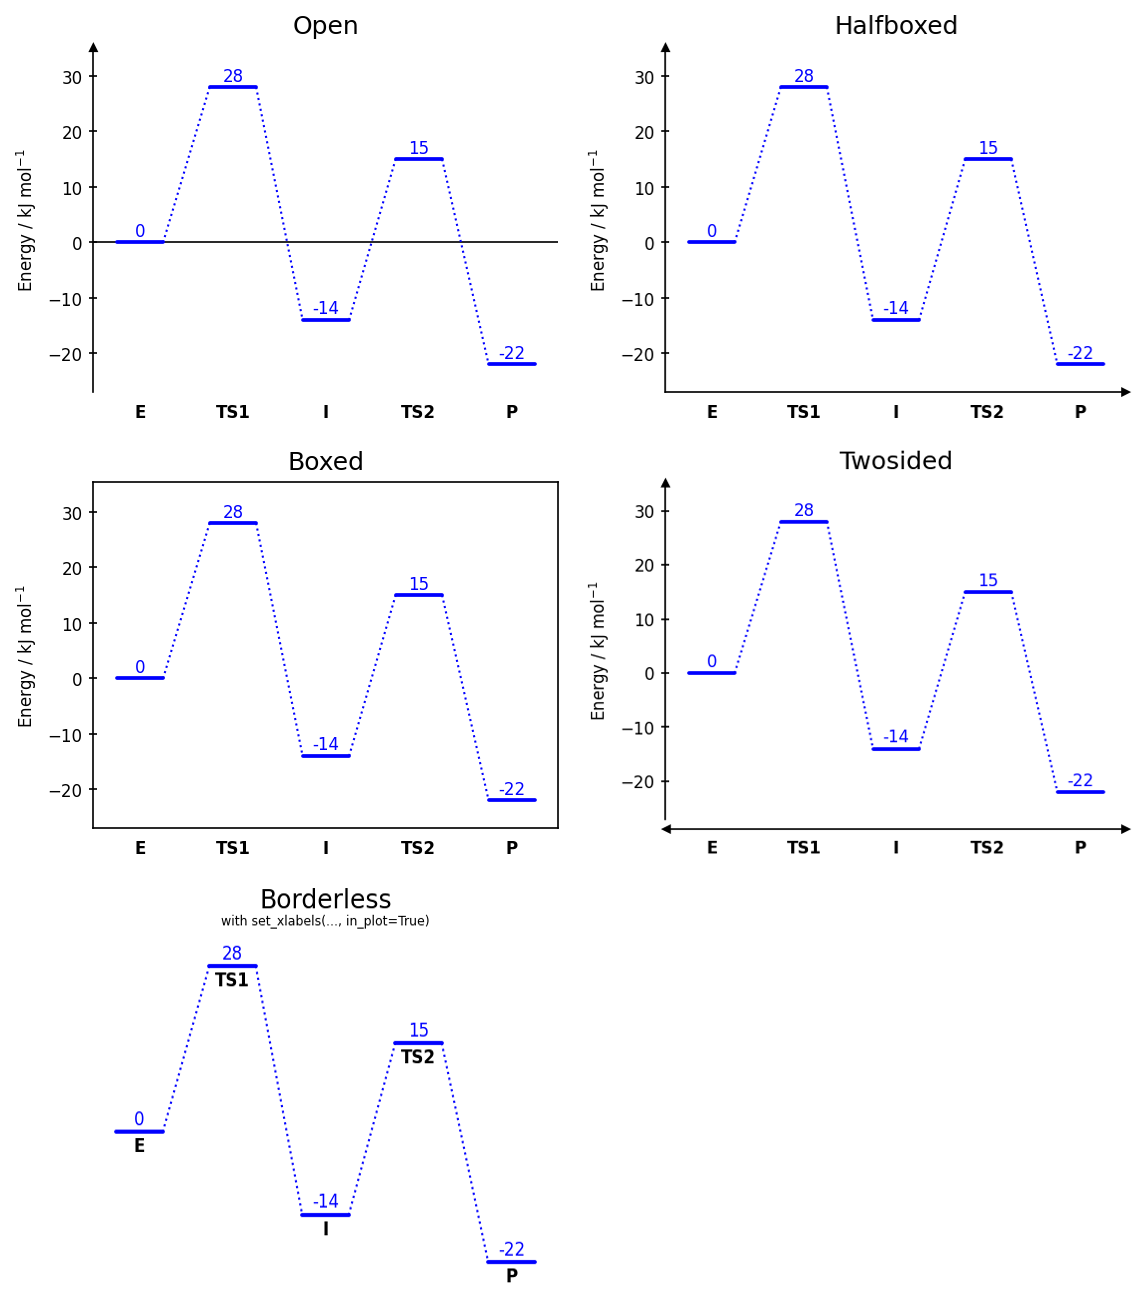
Diagram styles
dia = EnergyDiagram(style="halfboxed") # open | halfboxed | boxed | twosided | borderless
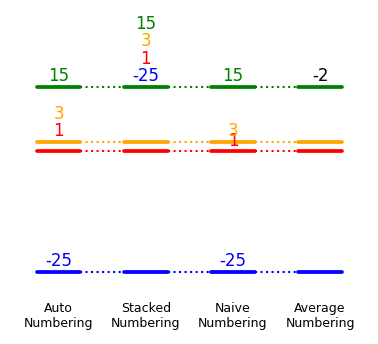
Energy labels
dia.add_numbers_auto()       # recommended
dia.add_numbers_stacked()
dia.add_numbers_naive()
dia.add_numbers_average()
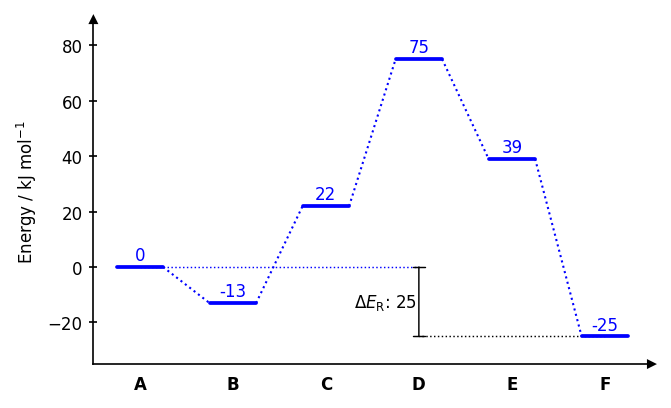
Energy difference bars
dia.draw_difference_bar(
    x=3,
    y_start_end=(-25, 0),
    description=r"$\Delta E_\mathrm{R}$: ",
    x_whiskers=(5, 0),
    left_side=True,
)
Images
dia.add_image_series_in_plot(
    ["img0.png", "img1.png", "img2.png", "img3.png", "img4.png"],
    y_placement="auto",
    width=0.6,
    proportional_scaling=True,
)
Saving figures
dia.fig.savefig("diagram.png", dpi=300, bbox_inches="tight")
dia.fig.savefig("diagram.pdf", bbox_inches="tight")