Templates
Templates allow you to customize default settings and diagram behavior for consistent styling across multiple diagrams. They provide a way to override constants, add startup modifications, and define custom methods for diagram creation.
Using a Built-in Template
chemdiagrams provides pre-configured templates. The default template automatically used if not specified otherwise is BaseTemplate. To use a template, pass it as a parameter when creating an EnergyDiagram:
from chemdiagrams import EnergyDiagram
from chemdiagrams.templates.example_template import ExampleTemplate

# Create a diagram with ExampleTemplate
dia = EnergyDiagram(template=ExampleTemplate())
dia.draw_path([0, 1, 2], [0, 10, -5], color="blue")
Available templates:
BaseTemplate— The default template with no modificationsTonnerZechTemplate— Template style of the Tonner-Zech groupExampleTemplate— Example template for demonstration purposes
Template Methods
__init__() — Override to customize default constants (link to constants).
startup(diagram) — Called at the beginning of diagram creation. Use to modify the diagram object before any plotting occurs. Must return the modified diagram.
Custom static methods — Define any custom post-processing methods you need for diagram modifications.
Creating a Custom Template
To create your own template, subclass BaseTemplate and override the __init__ and/or startup methods. Furthermore, static methods can be defined for automating common tasks. How this can be realized is shown with an example template.
from chemdiagrams.templates.base_template import BaseTemplate

class ExampleTemplate(BaseTemplate):
    def __init__(self):
        """
        Modyfy constants for Example style diagrams here.
        e.g. self.constants.DISTANCE_TEXT_DIFFBAR = 0.05
        """
        super().__init__()
        # Change constants here
        self.constants.WIDTH_PLATEAU = 0.4
        self.constants.LW_CONNECTOR = 0.6
        self.constants.MINUS_SIGN = "-" # minus sign for negative numbers used in numbering methods (default: "\u2212")

    def startup(self, diagram):
        """
        Startup function to be called at the beginning of the plotting process
        Here you can modify the diagram object before any plotting is done.
        """
        diagram = super().startup(diagram)
        # Change diagram here
        diagram.set_diagram_style("open")
        diagram.ax_objects.axes["x_axis"].remove()
        diagram.ax.grid(True, which="both", axis="y", ls="--", lw=0.5, zorder=-1)
        return diagram

    # Example of a custom function to modify the diagram after plotting
    @staticmethod
    def color_all_numbers(diagram, color):
        """Set the colors of all numbers to the specified color"""
        for path_numbers in diagram.numbers.values():
            for number in path_numbers.values():
                number.set_color(color)
        return diagram
Then place your custom template in the src/chemdiagrams/templates directory for reuse across projects. It can be imported with from chemdiagrams.templates.my_custom_template import MyCustomTemplate. You can use the custom template by passing it to EnergyDiagram:
from chemdiagrams import EnergyDiagram
from chemdiagrams.templates.my_custom_template import MyCustomTemplate

dia = EnergyDiagram(template=MyCustomTemplate())
...
You can also create the template directly in your script or notebook without saving it as a separate file, and pass an instance of the class to EnergyDiagram in the same way.
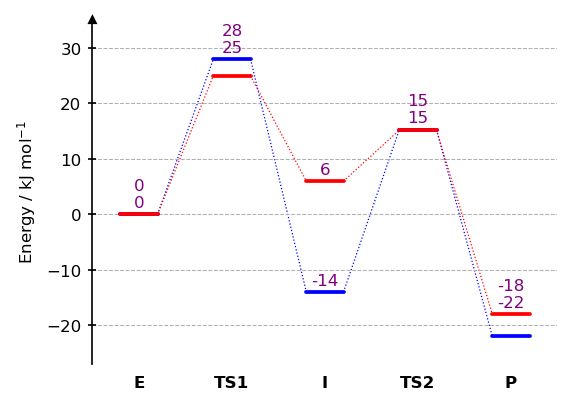
Example of using the custom static method defined in the template:
from chemdiagrams import EnergyDiagram
from chemdiagrams.templates.example_template import ExampleTemplate
import os.path

dia = EnergyDiagram(template=ExampleTemplate())

dia.draw_path(
    x_data=[0, 1, 2, 3, 4],
    y_data=[0, 28, -14, 15.3, -22],
    color="blue",
    path_name="Blue path",
)
dia.draw_path(
    x_data=[0, 1, 2, 3, 4],
    y_data=[0, 25, 6, 15.2, -18],
    color="red",
    path_name="Red path",

)
dia.add_numbers_auto()
dia.set_xlabels(["E", "TS1", "I", "TS2", "P"])
dia.ax.set_ylabel("Energy / kJ mol$^{-1}$", fontsize=8)

dia = ExampleTemplate.color_all_numbers(dia, color="purple")

dia.fig.savefig(os.path.join("..","docs","img","example_template.png"),format="png", bbox_inches="tight")
dia.show()